Retatrutide and VK2735: put the study weeks back on the chart
A 13-week curve and a 48-week curve answer different questions. Learn to reconstruct an obesity-trial headline before comparing the numbers from Bali.

A short trial with a steep early curve can make a compound look like the obvious winner. Extend that line with a ruler and almost any prediction becomes possible. The missing information is what actually happened after the last measured visit.
A weight-loss percentage needs a time label. When comparing retatrutide with VK2735 from Bali, a result measured after one study period cannot be treated as the outcome of another period simply because both appear in the same chart.
Put the calendar beside the percentage
The published retatrutide phase 2 study ran for 48 weeks. The sponsor's injected VK2735 VENTURE poster reports a 13-week study. Both used placebo groups; they did not randomize participants between these two molecules.
That leaves a basic reading rule: compare a result with its own study conditions first. A longer observation period may include more treatment exposure, but it does not tell us what the other drug would have achieved over the same period. Extending a line on a graph is a prediction, not an observed result.
A comparison card that keeps the context
When saving a headline, add these four fields underneath it:
- The molecule and whether the product was oral or injected.
- The week at which the outcome was measured.
- The people eligible to participate.
- Whether the percentage is change from starting weight or difference from placebo.
These labels are especially useful if you are planning a short Bali stay. A research time point is not a promise that a particular pen will deliver the same result before your return flight. A trip length and a clinical follow-up period answer different questions.
What would a direct comparison add?
A head-to-head trial assigns people within one study to the alternatives under a common protocol. Separate placebo-controlled studies can explain each programme, but combining their headline results does not recreate that design. Different recruitment rules, treatment exposure and analysis methods can affect the comparison.
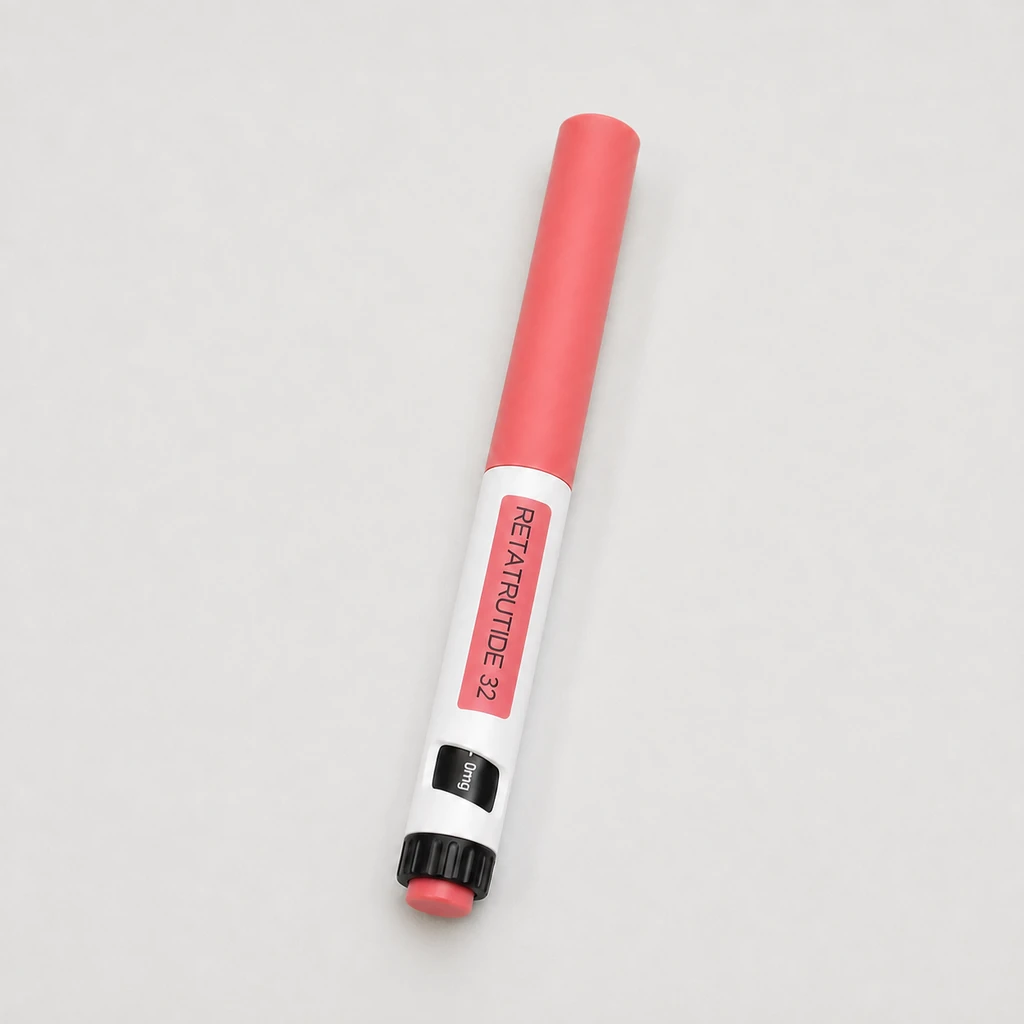
The retatrutide catalogue entry describes the offered presentation. Keep those product details apart from the trial comparison, and use related journal guides to follow the original research. A useful question for a clinician is what evidence fits your own goal, rather than which percentage looks largest on an unlabelled graphic.
Build two honest captions
For the published retatrutide study, identify both its primary measurement at week 24 and the longer observation at week 48. For the VK2735 phase 2a presentation, look for its week-13 time point. A chart can show both results if the labels retain those dates and the distinct control groups. It cannot use one set of observations to fill the unobserved weeks of the other.
| Dates behind the headline | What to look for |
|---|---|
| Starting point | Randomization or the first dose |
| Reading point | The numbered visit, in weeks |
| Comparison group | The concurrent control at that visit |
If a clinic in Bali forwards a slide without a time axis, send back a precise question: “Which visit, which treatment arm and which control result are on this slide?” That gets you further than asking for a larger image.