Reading the arrow from NAD+ to NADP+ without inventing a conversion rate
Decode a metabolic diagram with an NAD-kinase example, separating a chemical reaction, a measured rate and the amount on a Bali pen listing.
What is the percentage next to the arrow from NAD+ to NADP+? In most pathway drawings there is no percentage, because the drawing identifies a possible reaction. A quantitative answer needs an experiment with a defined tissue, timescale and method of measurement.
NAD kinase is an enzyme that connects NAD+ with NADP+ through phosphorylation. That explains why the names appear together in biology; it does not tell a Bali buyer that an NAD+ product automatically produces a particular clinical result.
The enzyme is part of the explanation
Primary research on NAD kinase examined how cellular signalling regulates NADP+ production. The enzyme's activity was studied in cells and in vitro. This is evidence about a biological process, rather than a trial of the catalogue pen.
The word “regulated” matters. A pathway has inputs, enzymes and conditions. Drawing an arrow between two chemical names summarizes that relationship; it does not state how much will be present in each tissue after a person uses a product.
Read an arrow as a question
When you see “NAD+ → NADP+” in a diagram, ask what the arrow represents. Is it an enzyme reaction, a measured change in a sample, or a claimed benefit? These are different statements, and the source should make the distinction clear.
A useful note might say: “This paper explains an enzyme mechanism; it did not measure my daily energy or test this retail presentation.” That keeps an interesting finding intact without asking it to answer a question it was not designed to investigate.
Apply this to a Bali product comparison
The PubChem record can help identify the chemical form. The NAD+ product entry describes the store's presentation. Keep those two kinds of information separate from a clinical discussion about symptoms or goals.
If a description promises an automatic chain from a product to a cellular pathway and then to a personal outcome, ask for evidence for each link. The journal provides background vocabulary. A clearer understanding of the enzyme relationship is useful on its own; it is not a reason to invent a conversion percentage, target blood level or self-treatment plan.
An exercise with the figure legend
Cover the artwork and read the legend for the NAD kinase experiment. Identify what the investigators changed, what material they sampled and how they distinguished the starting material from the product. Now look for a unit that includes time. A concentration at one moment and a production rate answer different questions even if both are reported in micromoles.
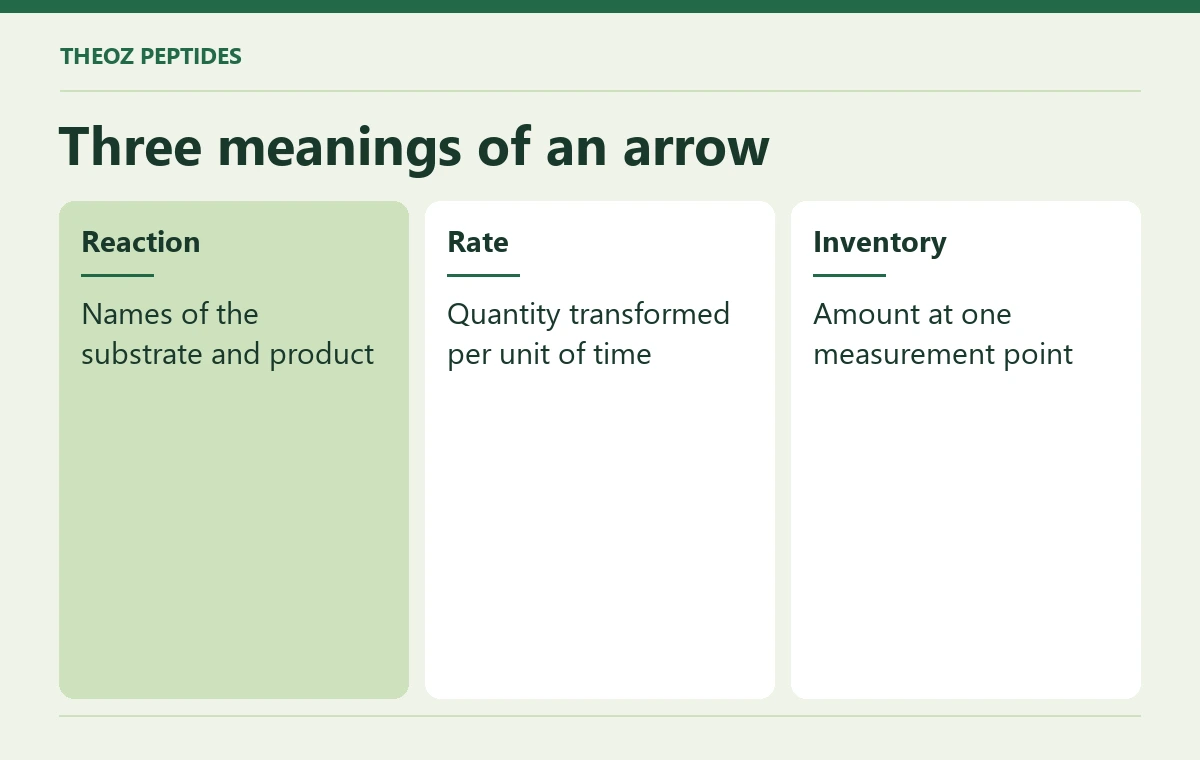
| Three meanings of an arrow | What to look for |
|---|---|
| Reaction | Names of the substrate and product |
| Rate | Quantity transformed per unit of time |
| Inventory | Amount at one measurement point |
A Bali catalogue entry can tell you the labelled contents of a presentation. An enzyme diagram can tell you how molecules are related. A result showing what happens to a precisely identified preparation in a particular group of people needs a third source. Those three lines belong in separate notes.