One dose, two curves: ipamorelin concentration and the GH response
A chart may show the concentration of ipamorelin falling while a second curve for growth hormone is still changing.
A chart may show the concentration of ipamorelin falling while a second curve for growth hormone is still changing. That is a coherent research finding. One variable is what happened to the compound, and the other is how a biological system responded. Confusing the two can make a graph look like a schedule for a retail blend.
Read the analyte labels
In the human ipamorelin PK/PD study, investigators measured concentrations and modelled a growth-hormone response in healthy volunteers. Pharmacokinetics describes the distribution and disappearance of the studied compound. Pharmacodynamics describes the measured response to it. The axes can use different scales and units. A curve marked “GH” is not a second measurement of ipamorelin. A peak in GH is not a demonstrated peak in muscle growth, recovery or any other functional outcome.
Why a response may peak later
A signalling step may separate exposure and the measured downstream response. In this study the investigators fitted an indirect-response model and described an episodic release of GH. A model helps summarize serial samples taken under the study protocol. Its parameters are estimates from a particular experiment. They cannot identify the best interval for an individual or map a vial's printed strength onto the height of a hormone curve.
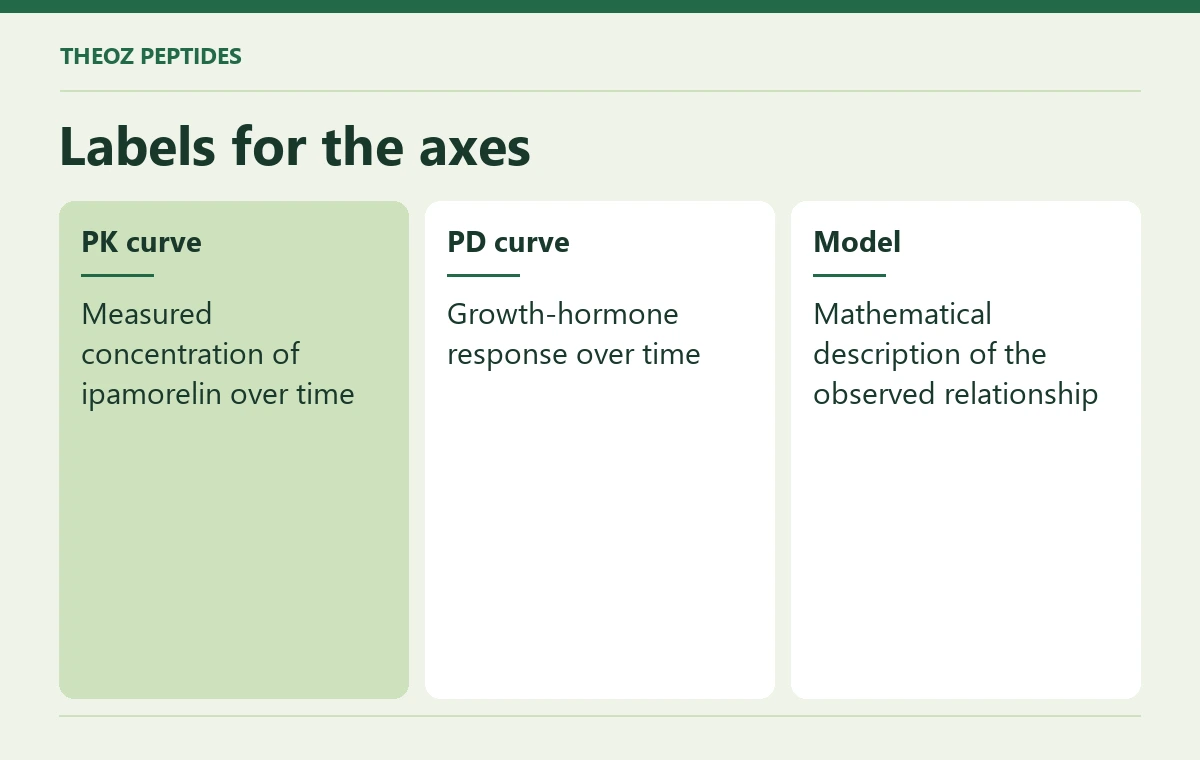
| Labels for the axes | What to look for |
|---|---|
| PK curve | Measured concentration of ipamorelin over time |
| PD curve | Growth-hormone response over time |
| Model | Mathematical description of the observed relationship |
Using the experiment to judge a blend claim
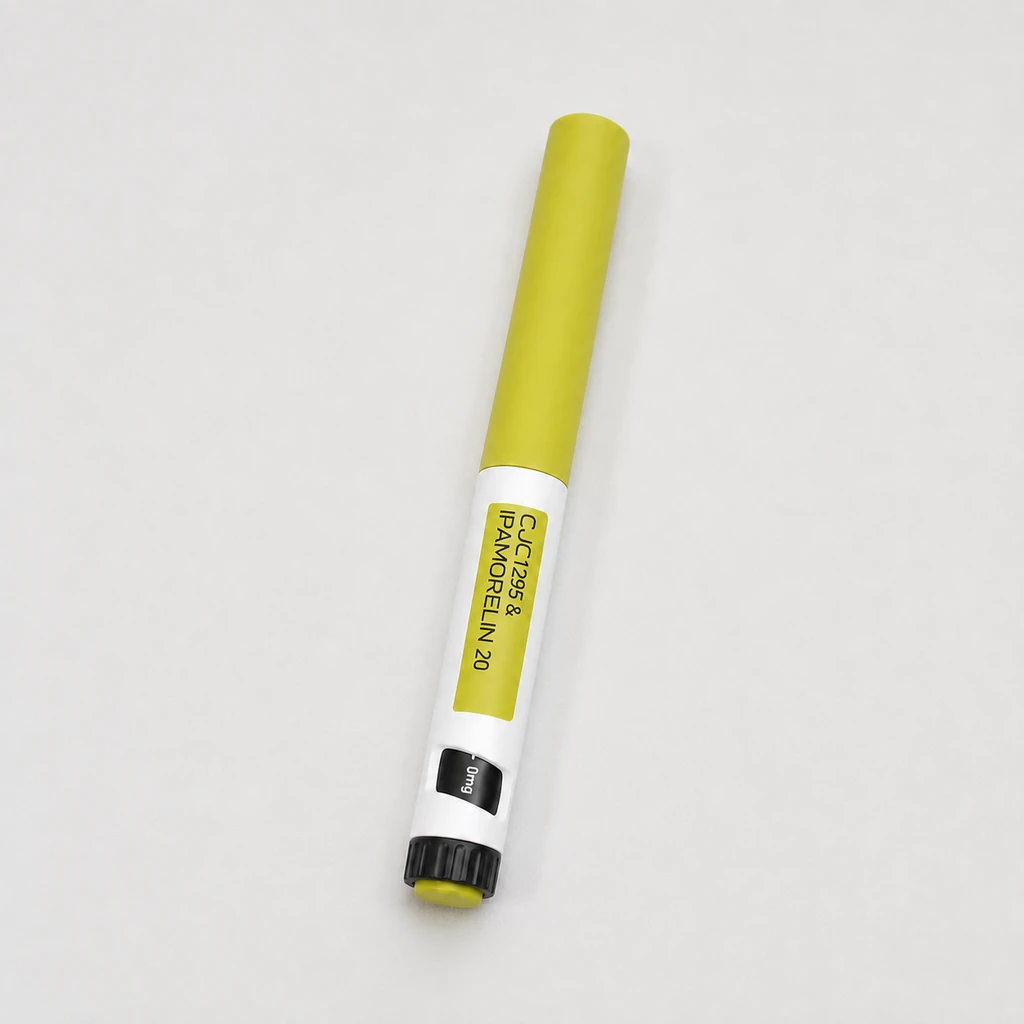
The Bali CJC-1295 and ipamorelin listing names two ingredients. A study of ipamorelin alone did not test this combination, its presentation or the duration of any combined clinical effect. A separate study of a long-acting CJC molecule would introduce another compound-specific question. Ask for the exact formulation, subjects, measurements and follow-up attached to the claim, and keep the two research records separate.
A quick check on a social-media graph
Cover the legend and try to label each curve, its unit and the people sampled. Then uncover the original legend and compare. If a graph has removed its axes or turns a plasma peak into a promise about athletic performance, the missing evidence is identifiable. A clinician can interpret a medical concern. No clock interval inferred from this experiment should become a personal regimen.